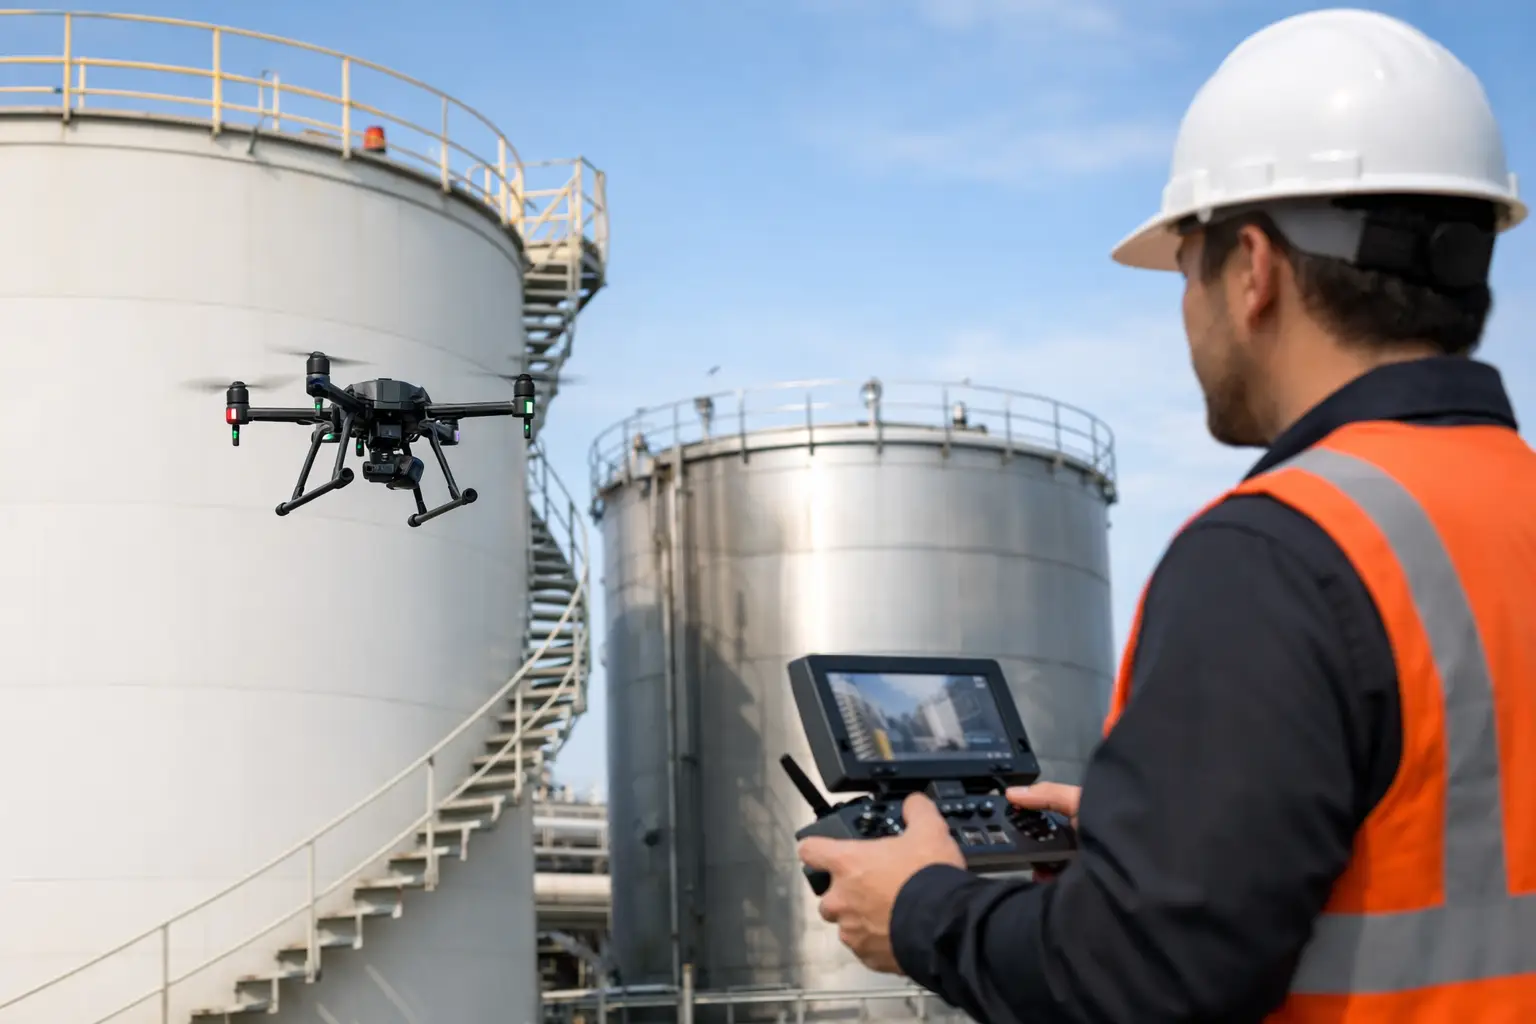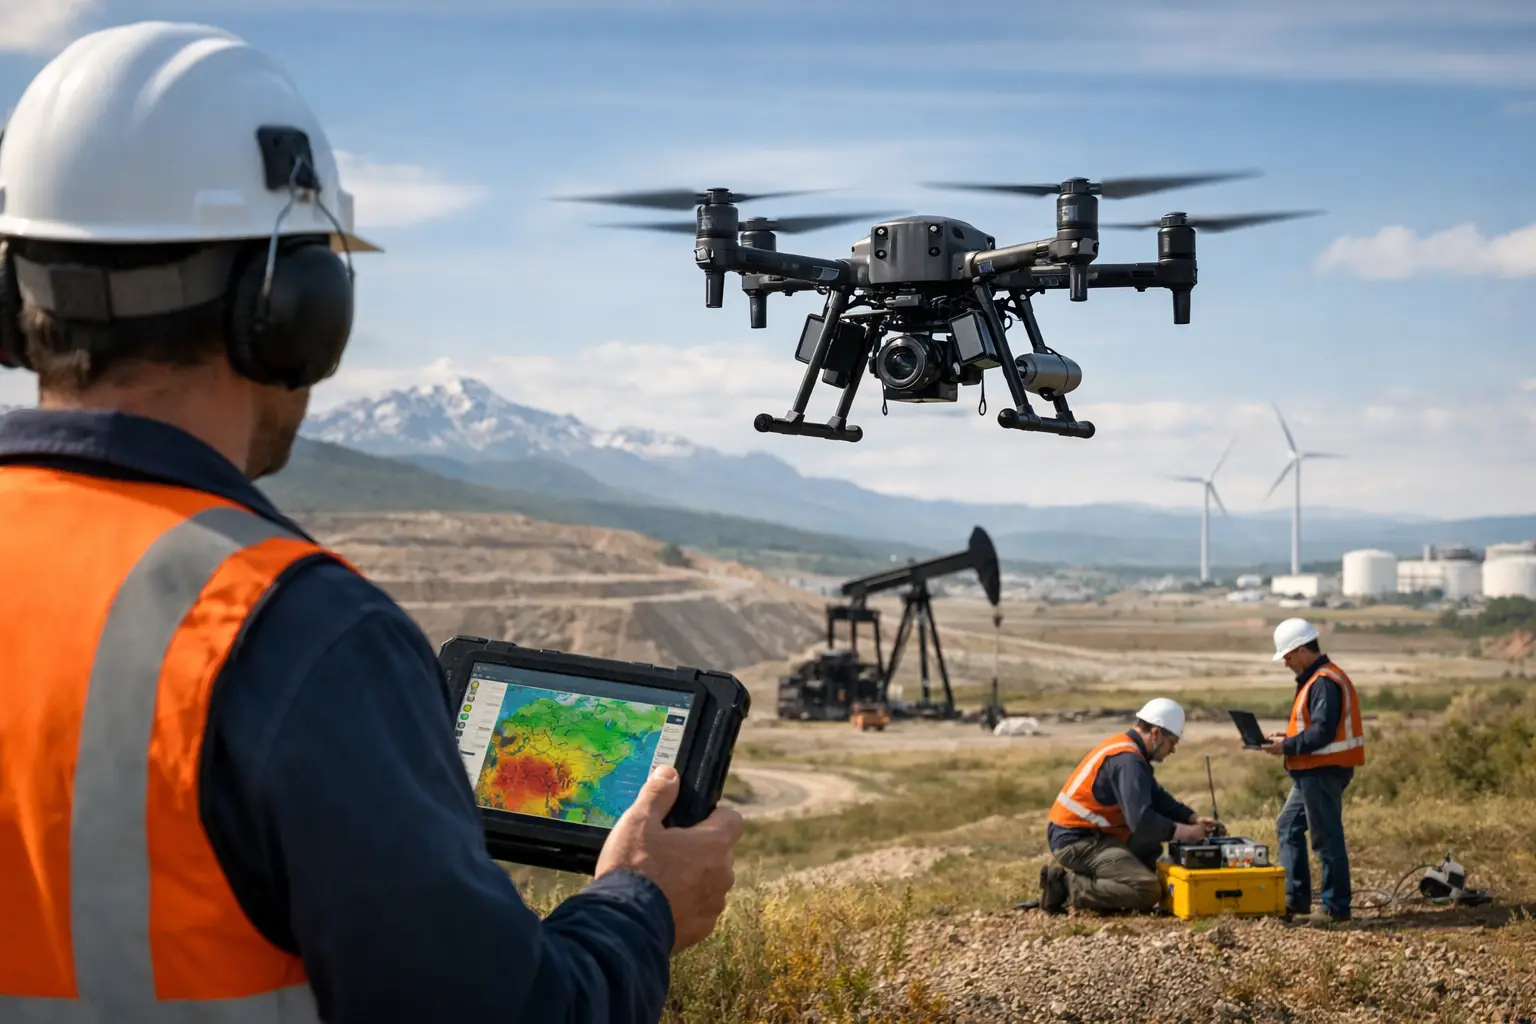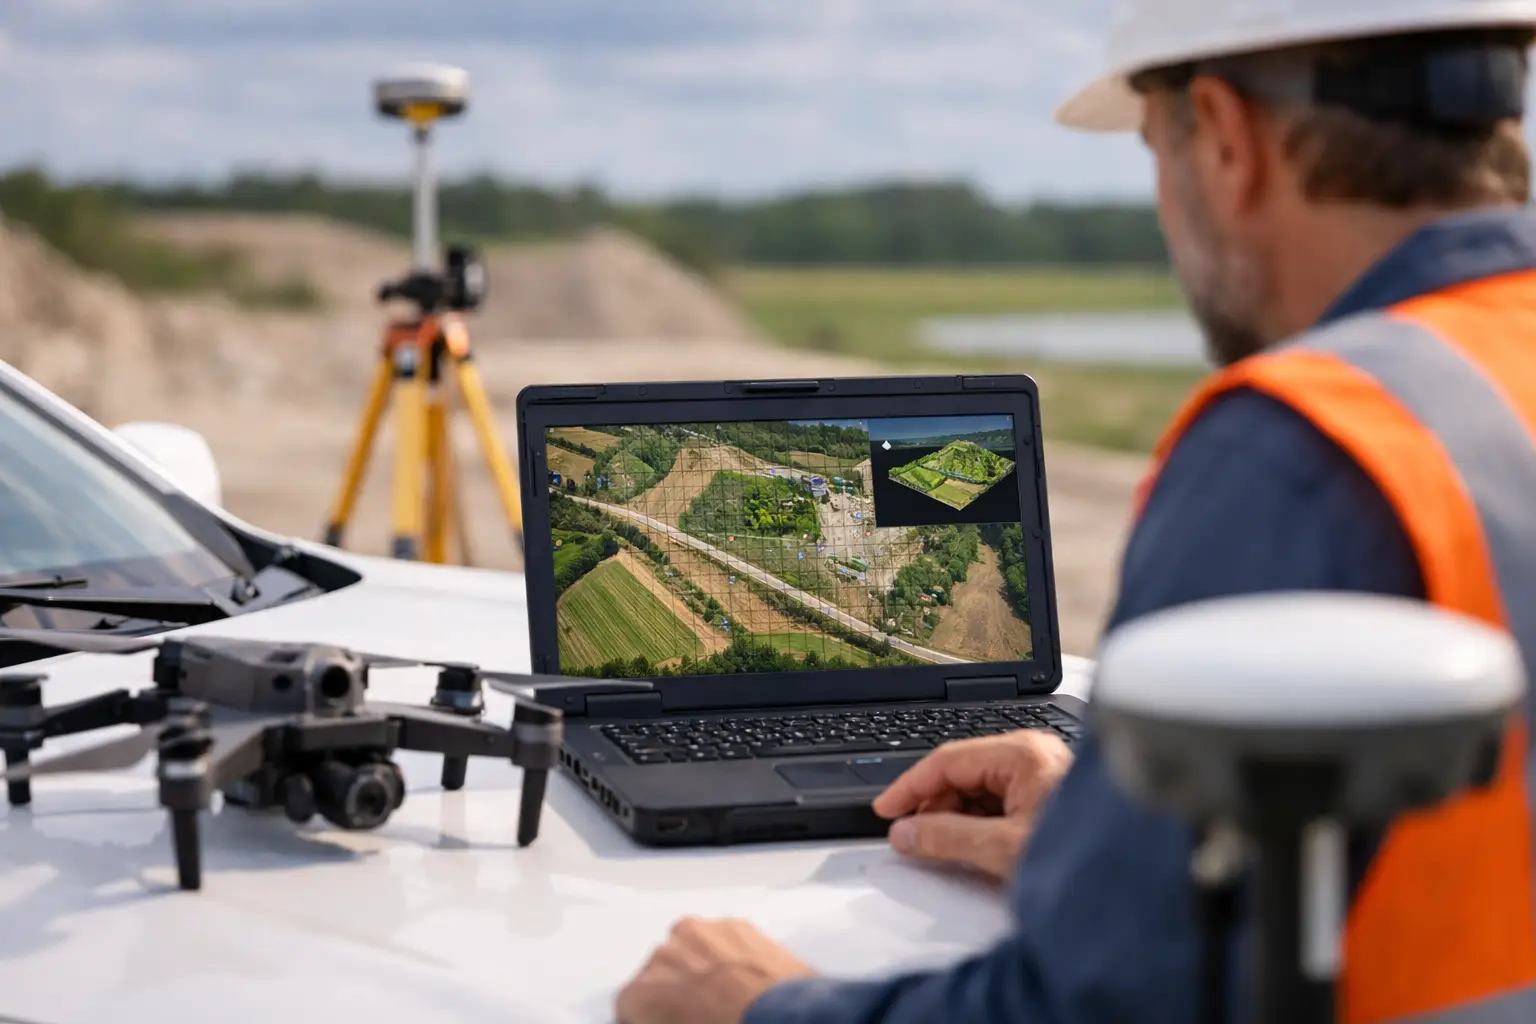
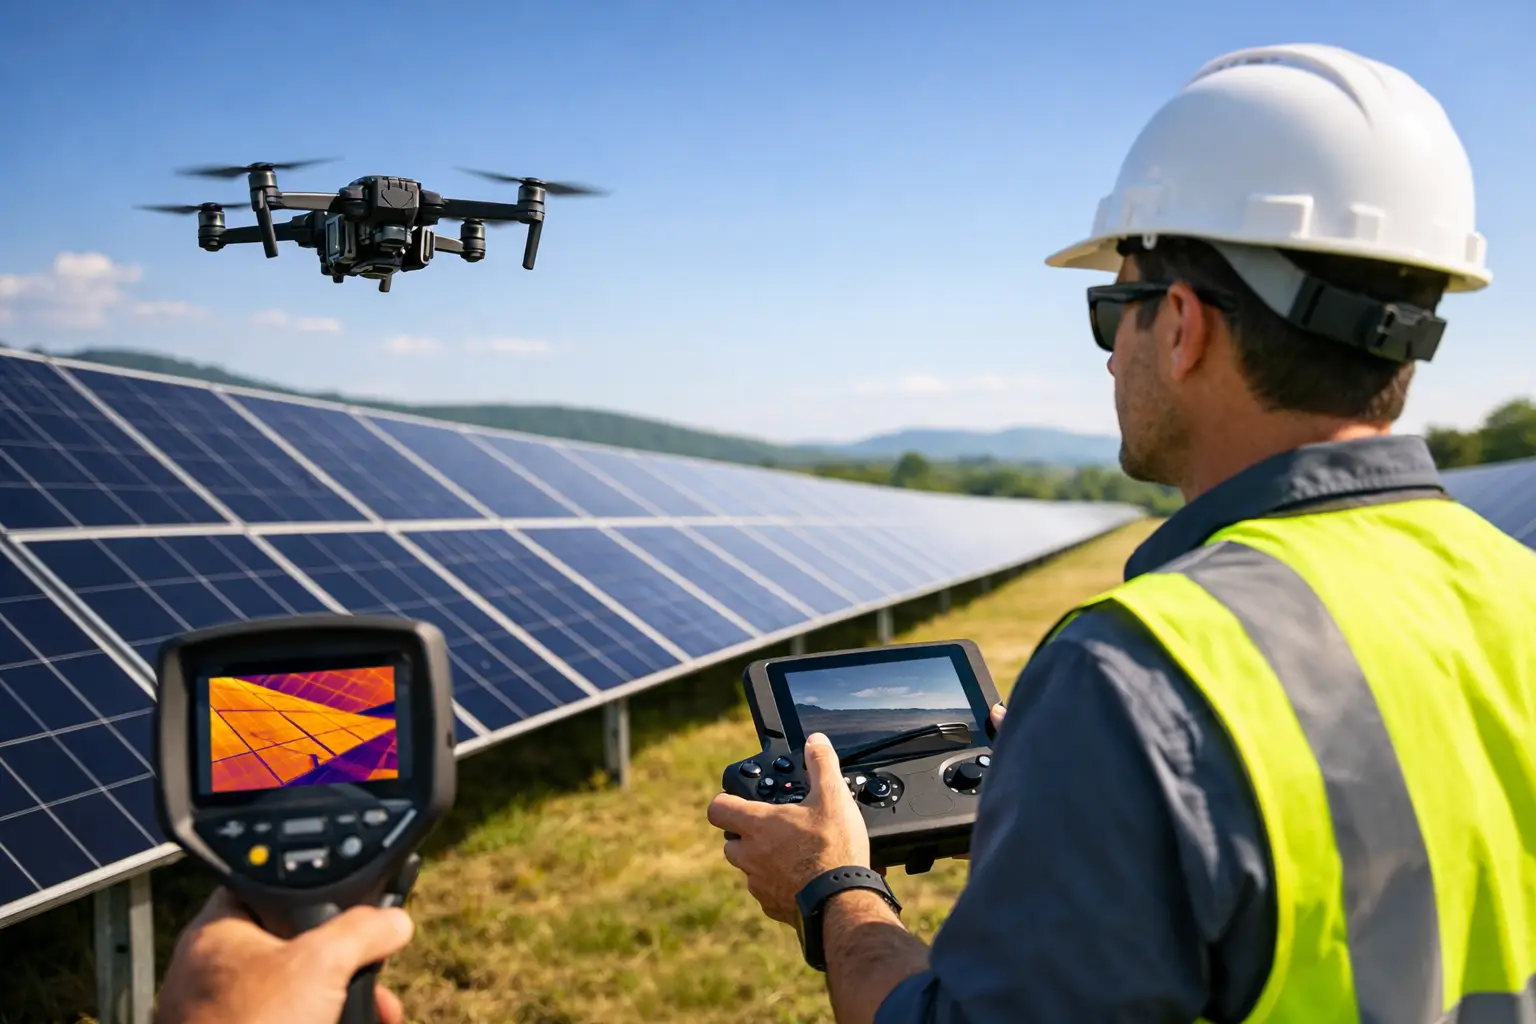
A single underperforming string can be difficult to see from the ground and expensive to leave unresolved. At utility scale, solar farm inspection is not a visual walkdown exercise. It is a controlled data-acquisition program that identifies defects, prioritizes corrective action, and creates an auditable record of asset condition across thousands or millions of modules.
For owners, EPC contractors, operators, and independent engineers, the objective is not simply to collect imagery. It is to determine which findings affect energy yield, safety, warranty exposure, maintenance cost, and long-term asset value. That requires calibrated sensors, repeatable flight parameters, environmental controls, and reporting that translates observations into field-ready work scopes.
What a Solar Farm Inspection Must Detect
Solar assets degrade through a combination of electrical, mechanical, environmental, and operational factors. Some failures produce distinct thermal signatures. Others are visible only through high-resolution photogrammetry or become apparent when inspection data is compared with production, SCADA, inverter, and maintenance records.
Thermal inspection is particularly effective for locating elevated-temperature anomalies that may indicate hot cells, defective bypass diodes, failed connectors, damaged modules, string imbalance, or localized resistance. A thermal anomaly is not automatically a confirmed root cause. Irradiance, module temperature, wind conditions, viewing angle, and load state all influence the result. A disciplined program distinguishes between a thermal observation and a verified defect requiring intervention.
High-resolution RGB imagery supports inspection of cracked glass, soiling patterns, delamination, module displacement, tracker misalignment, corrosion, fencing damage, drainage issues, access-road deterioration, and encroaching vegetation. For projects with tracker systems, imagery and spatial analysis can also identify abnormal row geometry, shading exposure, and mechanical conditions that warrant closer review.
The inspection scope should reflect the asset's risk profile. A new commissioning inspection may focus on installation quality, module condition, and tracker alignment. An operational inspection may prioritize yield loss, thermal fault localization, vegetation management, storm damage, and degradation trends. After a major weather event, the focus shifts toward rapid damage mapping and safe prioritization of field response.
Why Drone-Based Inspection Changes the Operating Model
Ground teams remain necessary for confirmation, electrical testing, and repair. They are not always the most efficient first layer of assessment across a large solar site. Manual sampling can miss distributed defects, while full-site walkdowns consume time, expose personnel to heat and uneven terrain, and often produce inconsistent documentation.
Drone-based inspection provides complete spatial coverage at a controlled altitude, sensor configuration, and overlap specification. It can rapidly establish where a problem exists, how extensive it is, and which assets should be isolated or investigated first. This changes maintenance planning from broad field searching to targeted verification and corrective work.
The operational benefit is significant in large, remote, or desert-based installations. Mobilization can be faster than conventional aerial methods, while low-altitude flight supports higher spatial resolution than many manned-aircraft approaches. The trade-off is that drone data quality depends heavily on mission planning, airspace compliance, battery logistics, weather windows, and experienced crews capable of managing sensor calibration and flight execution.
A useful inspection program does not treat drones as cameras. It treats them as measurement platforms operating within documented tolerances.
Thermal data requires controlled collection conditions
Thermal surveys must be performed under conditions suitable for meaningful interpretation. Modules need sufficient irradiance and electrical loading for many defect types to present clearly. Rapid cloud movement, low irradiance, excessive wind, recent rain, or unusual ambient conditions can reduce confidence or create misleading patterns.
Sensor selection and calibration matter as much as flight speed. The thermal payload must have appropriate radiometric capability, resolution, lens configuration, and temperature sensitivity for the inspection objective. Flights should maintain controlled ground sampling distance, overlap, and viewing geometry. Raw thermal files, mission logs, calibration records, and environmental observations should be retained as part of the QA/QC trail.
RGB and LiDAR add operational context
Thermal imagery tells an operator where heat behavior differs. RGB imagery often helps explain the physical context: debris on a module, shading, broken glass, loose hardware, vegetation, or tracker position. Orthomosaics and three-dimensional photogrammetric models provide a site-wide visual reference that can be measured, reviewed, and compared across inspection cycles.
LiDAR can add value where terrain, drainage, erosion, access routes, structural clearances, or vegetation encroachment affect solar operations. It is not required for every inspection. On flat, well-documented sites, RGB and thermal data may provide the necessary coverage. On complex terrain or large infrastructure corridors, LiDAR-derived elevation models can support engineering decisions that conventional imagery cannot resolve as reliably.
A Defensible Solar Farm Inspection Workflow
A reliable program begins before the aircraft launches. The inspection team should define asset boundaries, block identifiers, module and tracker configurations, inverter zones, known fault history, safety restrictions, and acceptance criteria. Without a structured asset register, anomalies cannot be consistently assigned to the equipment teams must inspect and repair.
The workflow should then move through four controlled stages:
- Mission design and preflight QA/QC - Establish sensor settings, flight altitude, overlap, target resolution, environmental thresholds, control points where required, and site-specific safety controls.
- Calibrated field acquisition - Capture thermal and visual data using repeatable flight lines, documented weather observations, and complete coverage checks before demobilization.
- Processing and anomaly classification - Georeference data, review image quality, identify anomalies, remove false positives, assign severity categories, and correlate findings with asset identifiers.
- Decision-grade reporting - Deliver mapped findings, anomaly registers, supporting imagery, confidence notes, repair priorities, and files compatible with GIS, maintenance, and engineering workflows.
The distinction between detection and classification is critical. Automated analytics can accelerate the identification of potential anomalies, particularly across large datasets. However, automated flags require technical review. Reflections, shadows, dirt accumulation, changing irradiance, and sensor artifacts can resemble genuine faults. Human interpretation, cross-validation with RGB data, and targeted ground confirmation protect the integrity of the final defect register.
Prioritizing Findings by Business Impact
Not every anomaly deserves the same maintenance response. A practical report ranks findings according to likely consequence, confidence, location, and the cost of delayed action. A suspected connector issue near critical infrastructure may demand immediate investigation, while minor soiling variation may be incorporated into routine cleaning plans.
Severity classifications should be tailored to the asset and operator's maintenance framework. They commonly consider thermal differential, affected area, electrical configuration, safety exposure, repeat occurrence, and probable production impact. When inspection results are integrated with SCADA data and inverter performance, operators can better separate visually notable issues from faults that are materially affecting generation.
This is also where repeat surveys become more valuable than isolated campaigns. One survey establishes a condition baseline. Subsequent surveys show whether an anomaly is stable, worsening, repaired, or recurring. Trend data supports warranty discussions, contractor performance review, spare-parts planning, and capital maintenance decisions.
Common Inspection Failures to Avoid
The most frequent failure is commissioning an imagery collection exercise without defining the decision it must support. A folder of photographs is not a maintenance strategy. The deliverable must identify location, defect type, severity, evidence, confidence level, and recommended next action.
Another common issue is collecting thermal imagery outside acceptable operating conditions. Fast deployment is valuable, but invalid data collected quickly still creates rework. It is better to document a constrained weather window and schedule a controlled reacquisition than to overstate confidence in marginal data.
Teams should also avoid reporting every thermal variation as a module failure. Soiling, glare, differing emissivity, rear-side conditions, and temporary operating states can affect apparent temperatures. Technical interpretation must be traceable and conservative where evidence is incomplete.
Finally, inspection data should not remain isolated from the owner's operating systems. Georeferenced anomaly registers, GIS-ready layers, annotated maps, and structured asset IDs allow findings to move into work orders, repair verification, and future inspection baselines.
Building Inspection Into Asset Performance Management
Inspection frequency depends on site age, climate, module technology, vegetation pressure, weather exposure, warranty requirements, and operating history. High-risk or rapidly changing sites may require seasonal inspections and event-driven surveys. Stable sites may benefit from annual condition assessments supplemented by targeted investigations when production data indicates a problem.
For large portfolios, consistency is as important as frequency. Comparable sensor settings, flight plans, classification rules, and report structures make it possible to benchmark performance across sites and years. That consistency is especially valuable to owners operating assets across harsh climates, where heat, dust, and remote logistics can magnify small maintenance delays.
Air Solutions approaches solar inspection as a geospatial intelligence assignment: calibrated airborne acquisition, documented QA/QC, cross-validated interpretation, and technical outputs that maintenance and asset-management teams can act on. The value lies in reducing uncertainty before crews, equipment, and downtime are committed.
A well-designed inspection program gives operators more than a defect map. It gives them a defensible basis for deciding what to repair first, what to monitor, and where the next megawatt-hour of recovered performance is most likely to be found.