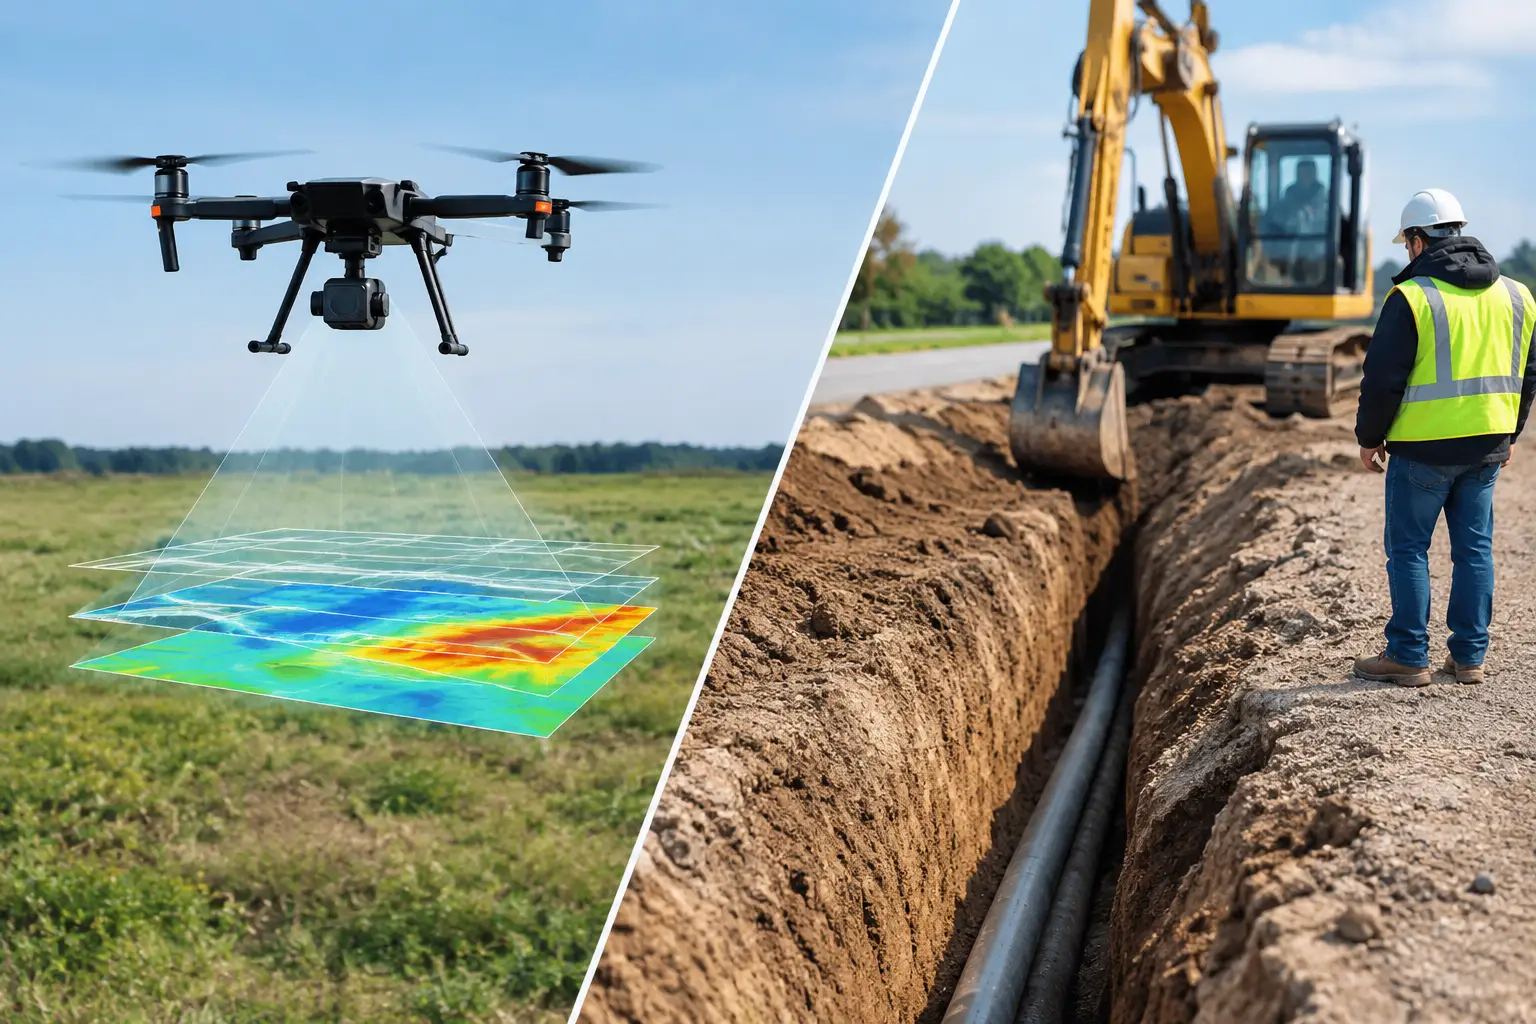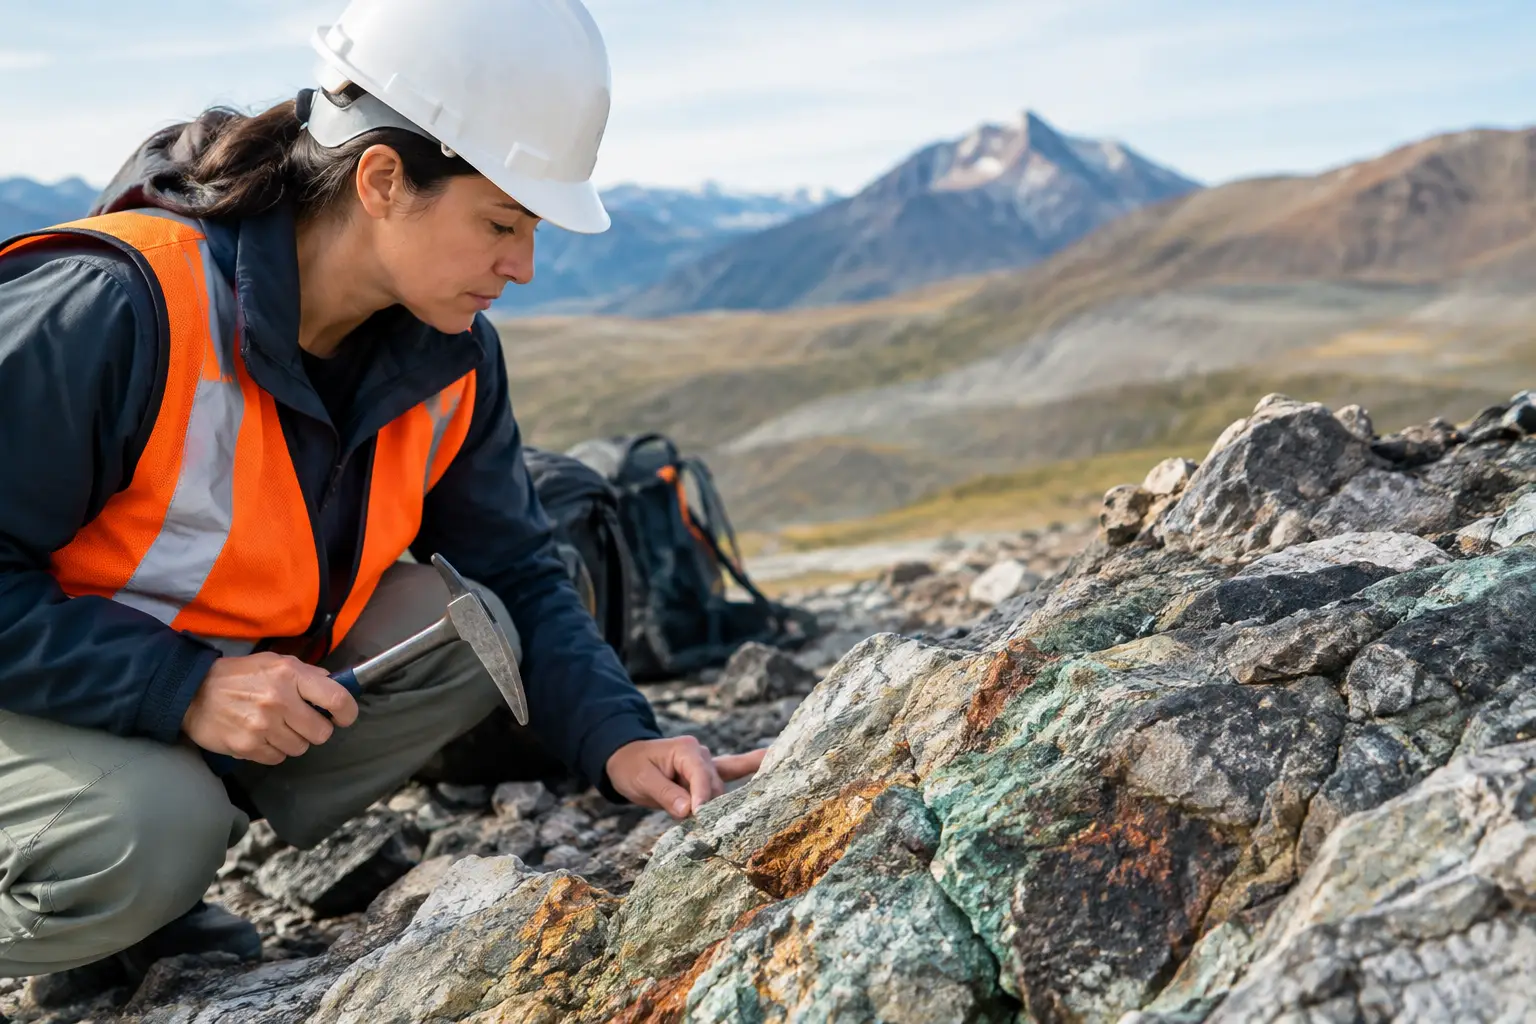

A pale alteration zone, a stressed irrigation block, and exposed waste rock can appear similar in standard aerial imagery. Their spectral behavior is not similar. Hyperspectral analytics separates these materials by measuring how they reflect energy across hundreds of narrow wavelength bands, then converting that signal into interpreted intelligence that can guide drilling, engineering, environmental monitoring, and asset planning.
For industrial programs, the value is not a visually compelling map. It is a calibrated, traceable assessment of material distribution, anomaly confidence, and field priorities. When deployed from a drone platform, hyperspectral sensing can provide high-resolution coverage with faster mobilization and lower field exposure than many conventional survey approaches.
What Hyperspectral Analytics Actually Measures
A conventional RGB camera records broad red, green, and blue bands. Multispectral sensors add a limited number of wider bands, often including near-infrared. A hyperspectral sensor records a continuous or near-continuous spectrum in dozens or hundreds of narrow channels. Each pixel contains a spectral signature rather than simply a color value.
That distinction matters because minerals, soils, vegetation, water, coatings, and manufactured materials absorb and reflect energy differently at specific wavelengths. Iron oxides, clay minerals, carbonates, sulfates, and alteration assemblages may produce identifiable absorption features, particularly in the visible-near infrared and short-wave infrared ranges. Hyperspectral analytics compares measured spectra against calibrated reference information and spatial context to classify or prioritize those responses.
The process is not a single software step. Reliable interpretation depends on sensor calibration, atmospheric correction, georeferencing, noise management, spectral library selection, and validation against field or laboratory evidence. A map generated without those controls may be attractive but unsuitable for technical decisions.
Hyperspectral Analytics as an Operational Workflow
For resource, water, and infrastructure projects, the survey design should begin with a decision requirement. The question may be whether alteration minerals extend beneath shallow cover, where acid-generating materials are exposed, which vegetation zones show water stress, or whether construction materials are distributed as specified. That question determines the spectral range, ground sampling distance, flight geometry, timing, and validation plan.
Acquisition Must Protect Spectral Integrity
Drone-based hyperspectral acquisition requires disciplined control of illumination, altitude, overlap, speed, sensor temperature, and platform stability. Desert environments introduce additional considerations: high solar loading, haze, dust, terrain shadow, and rapidly changing surface conditions can affect radiometric consistency.
Field teams should collect calibration targets and document weather, solar conditions, flight parameters, and instrument status. Where the site demands it, ground spectra and physical samples provide an independent reference for target materials. These records form the beginning of an auditable chain from acquisition through interpretation.
Processing Converts Measurements Into Comparable Data
Raw hyperspectral data contains sensor and atmospheric effects that must be addressed before material interpretation. Processing commonly includes radiometric calibration, bad-band removal, orthorectification, atmospheric correction, reflectance conversion, mosaicking, and co-registration with terrain models or other geospatial layers.
The objective is to create a spatially accurate reflectance dataset where one pixel can be compared meaningfully with another. Accuracy requirements vary by application. A regional mineral screening program may prioritize broad coverage and anomaly ranking, while an engineering investigation may require tighter positional control and detailed correlation with site plans, boreholes, or LiDAR-derived terrain.
Interpretation Requires More Than Automated Classification
Algorithms can identify spectral similarity, detect anomalies, reduce data dimensionality, and classify materials at scale. They do not remove the need for geoscience judgment. Weathered surfaces, mixed pixels, moisture, grain size, vegetation cover, and atmospheric residuals can shift or obscure spectral features.
A defensible interpretation combines algorithmic outputs with geological setting, field observations, structural mapping, and available laboratory data. Results should communicate confidence, limitations, and recommended follow-up rather than presenting every classified pixel as confirmed ground truth.
Where the Technology Produces Commercial Value
Hyperspectral surveys are particularly effective when a project needs material intelligence across large, difficult, or safety-sensitive areas without treating every location as a ground investigation target.
In mineral exploration, hyperspectral data can map alteration patterns and surface mineral assemblages associated with prospective systems. It does not directly image deep ore bodies. Its role is to improve surface understanding, refine structural and lithological interpretation, and rank targets for ground verification, geochemistry, geophysics, or drilling. In areas with extensive cover, its value depends on the degree of exposure and the relationship between surface expression and the target geology.
For mine operations and environmental programs, the same sensing approach can support mapping of exposed lithologies, hydrothermal clays, iron-bearing materials, waste-rock variability, revegetation condition, and surface moisture patterns. Repeat acquisition creates a measurable record of change, provided that collection conditions and processing standards remain comparable between campaigns.
Water-resource teams can use hyperspectral analytics to assess vegetation stress, surface salinity indicators, evapotranspiration proxies, and visible moisture-related patterns. These indicators are not substitutes for hydrological monitoring wells or groundwater models. They are spatial evidence layers that help planners identify where field investigation and integrated analysis should be concentrated.
For infrastructure and industrial sites, hyperspectral data can distinguish selected surface materials, characterize corrosion-related staining in some contexts, identify vegetation encroachment, and support environmental baseline surveys. Performance depends on spectral contrast, spatial resolution, line of sight, and whether the target material has a stable diagnostic signature.
Why Data Fusion Changes the Result
A hyperspectral dataset is strongest when it is not evaluated in isolation. Terrain, structure, surface roughness, and subsurface indicators often determine whether a spectral anomaly is operationally meaningful.
LiDAR contributes high-density elevation and surface-form information, helping analysts account for slope, drainage, exposure, and terrain shadow. Photogrammetry provides detailed visual context and orthomosaics for field navigation. Aeromagnetic, electromagnetic, radiometric, and ground geophysical datasets can add structural or subsurface evidence that cannot be derived from spectral imagery alone.
For example, a clay-mineral anomaly may be more relevant to exploration when it aligns with mapped structures, magnetic discontinuities, and field-verified alteration. A vegetation stress pattern may be more actionable when assessed alongside drainage geometry, utility alignments, groundwater observations, and thermal conditions. Multi-sensor fusion reduces the risk of making expensive decisions from a single ambiguous signal.
QA/QC Determines Whether the Output Is Defensible
Enterprise buyers should evaluate hyperspectral deliverables by asking how the result was controlled, not only what materials appear on the final map. A credible program establishes data lineage from flight planning to final reporting and documents the assumptions used in interpretation.
Key QA/QC controls include sensor calibration records, flight logs, reflectance calibration methods, positional accuracy assessment, spectral quality checks, processing parameters, classification methodology, and independent validation points. Version-controlled data products are particularly important for repeat monitoring programs, regulatory submissions, and technical due diligence.
The final deliverable should match the operational need. It may include calibrated reflectance mosaics, material probability maps, anomaly polygons, confidence layers, spectral plots, field-verification locations, GIS-ready files, and an interpreted report that explains what the data supports and where uncertainty remains. Raw cubes alone shift too much analytical burden to the client team.
Selecting the Right Survey Scope
The correct scope depends on the project decision, not the sensor specification. A rapid reconnaissance survey may use lower spatial resolution and a focused interpretation to prioritize a large area. A mine-scale material characterization program may require denser flight lines, field spectroscopy, repeat coverage, and integration with operational datasets.
Timing also matters. Seasonal vegetation condition, dust, recent rainfall, sun angle, and active earthworks can materially change the outcome. Sites with dense vegetation, heavy atmospheric haze, limited exposed material, or targets without diagnostic spectral features may require a different sensor mix or more extensive ground control. Hyperspectral analytics is powerful, but it is not a universal replacement for sampling, drilling, or subsurface geophysics.
Air Solutions approaches these programs as interpreted geospatial intelligence assignments rather than sensor deployments. The objective is to provide decision-grade evidence that technical teams can cross-validate, defend, and act on within defined project constraints.
The most productive next step is to define the decision that must be made after the survey, the evidence required to support it, and the field verification available to test it. That discipline turns spectral data into a controlled asset for exploration, engineering, and environmental management.