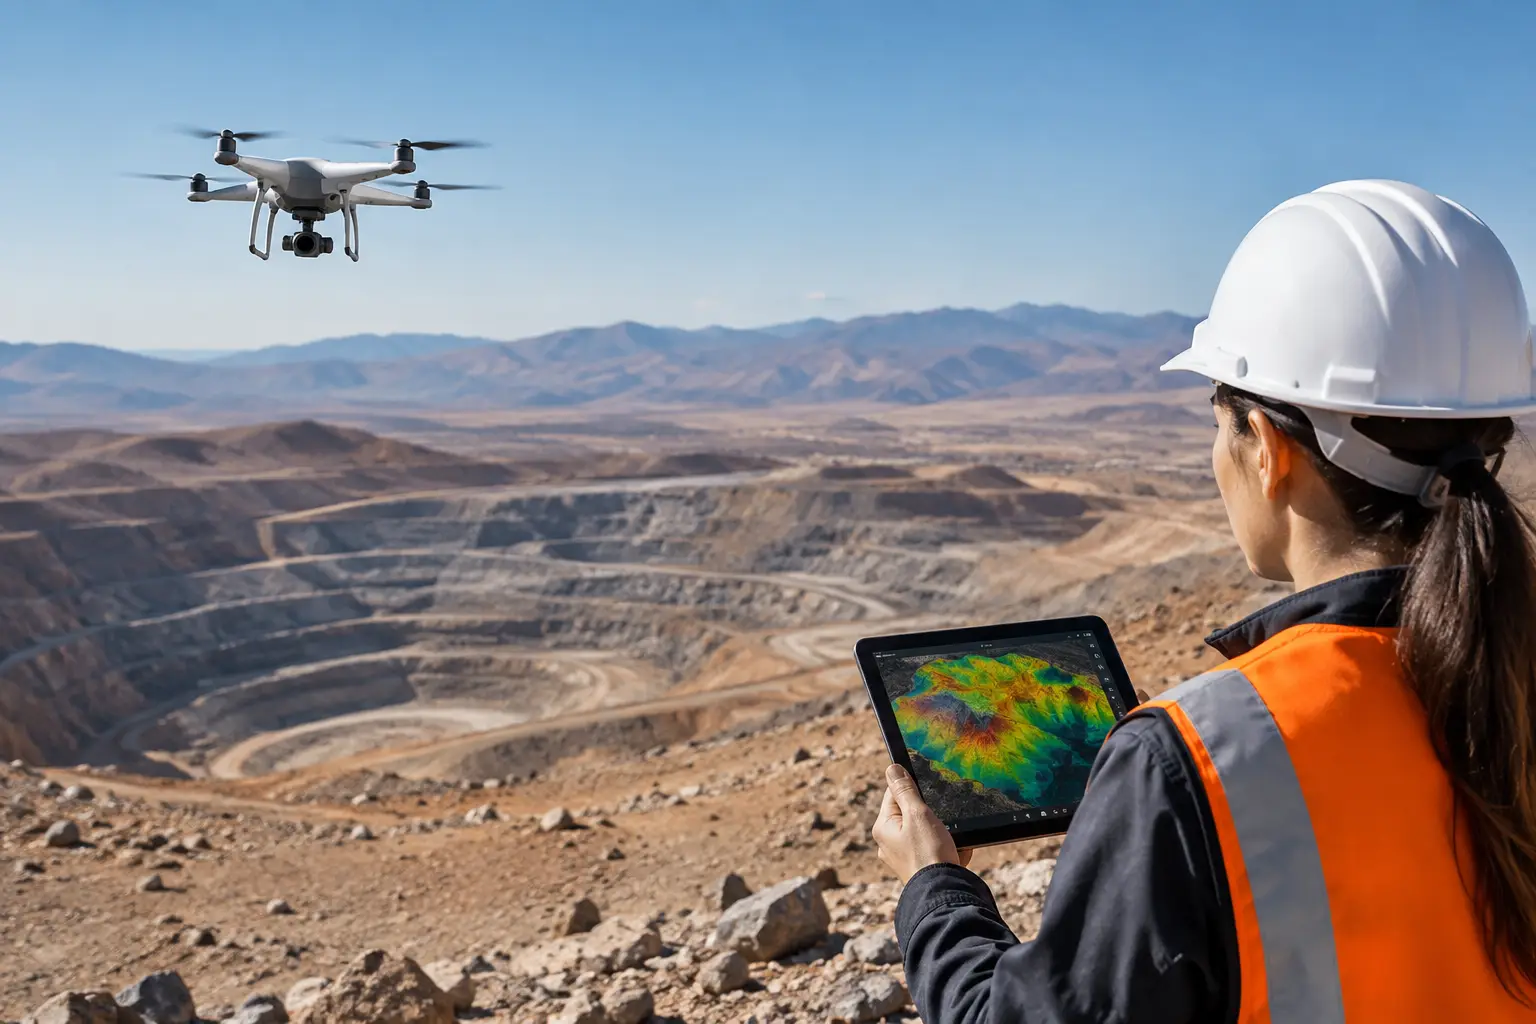
A promising mineral trend in a desert is not yet a drill target. It is often a partially exposed structural system obscured by sand cover, weathered rock, access constraints, and incomplete legacy data. This desert mine mapping example shows how a calibrated drone survey can convert that uncertainty into a defensible target model - from flight planning through interpreted outputs and drill prioritization.
The scenario is representative of an early-to-intermediate-stage exploration program in an arid, structurally complex terrain. It is not a claim that any one sensor can prove mineralization. The objective is more disciplined: identify and rank geological, geophysical, and geomorphological indicators that justify the next dollar spent on field verification and drilling.
Desert Mine Mapping Example: The Exploration Problem
Assume an exploration team holds a 42-square-mile concession containing altered volcanic and sedimentary units, several mapped fault corridors, and scattered historical workings. Existing regional magnetic data suggests a major structural boundary, but the data spacing is too coarse to resolve local offsets, intrusive bodies, or the faults most likely to control mineralizing fluids.
The site presents familiar desert constraints. Rock exposure is intermittent. Wadis interrupt surface access. Summer temperatures narrow productive field windows. Ground traverses can be slow and can leave large gaps where terrain is unsafe or impractical. The team needs a higher-resolution basis for deciding where to map, sample, trench, and drill.
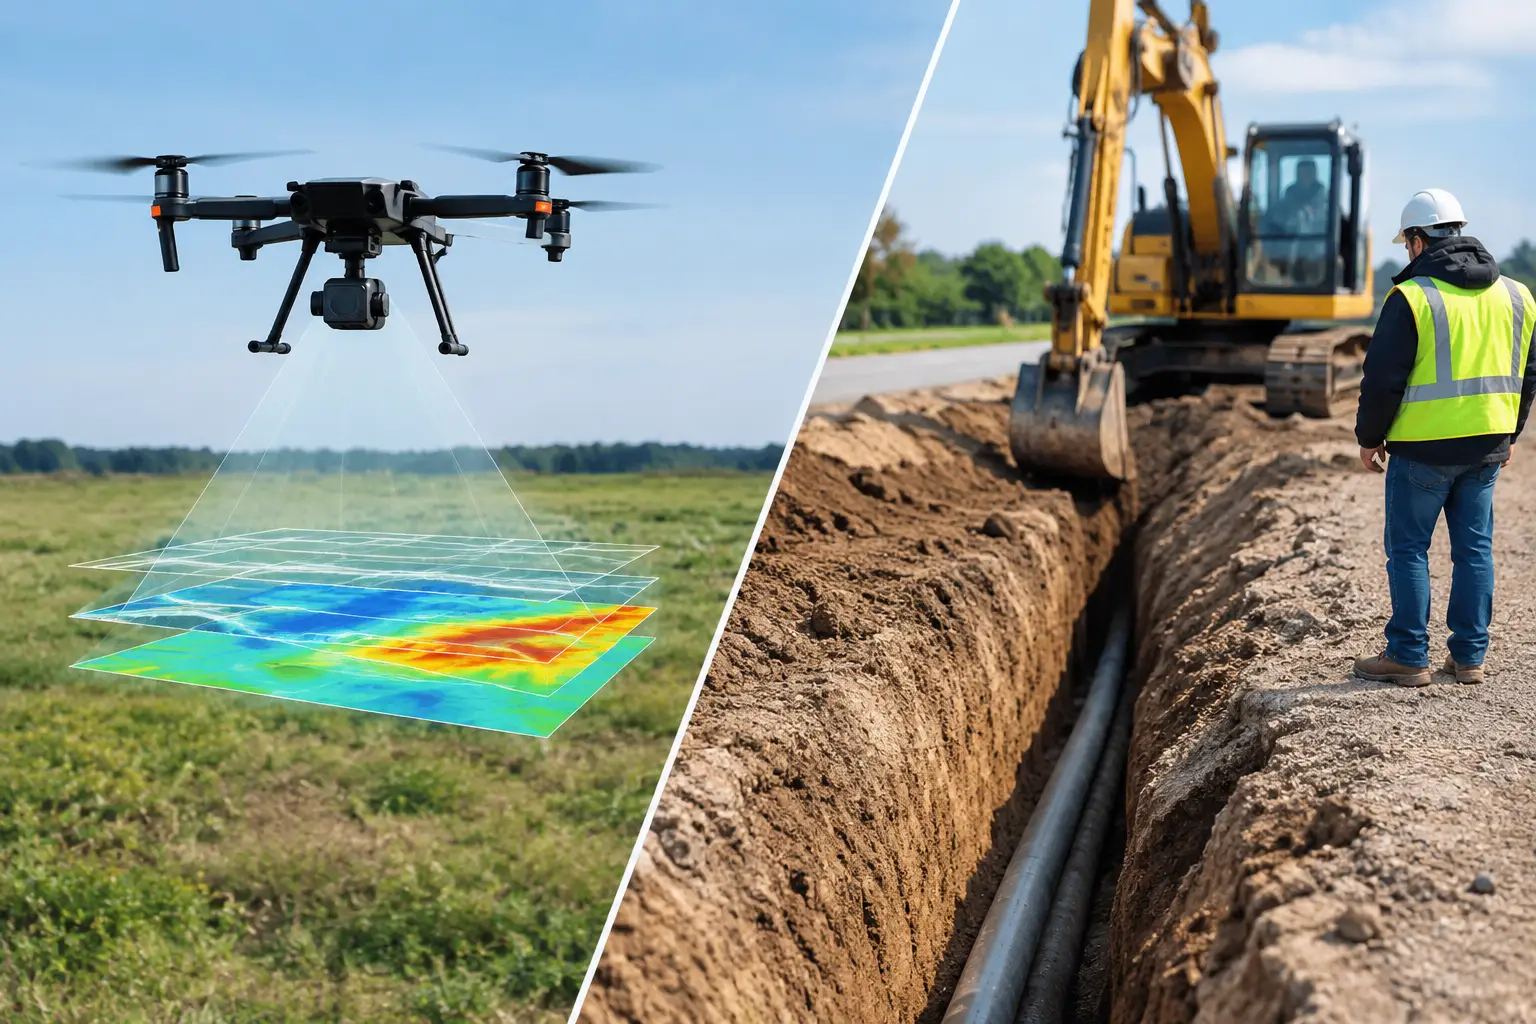
A drone-based program is selected because it can mobilize quickly, operate at low altitude, and collect multiple spatially aligned datasets over the same target area. The deliverable is not a folder of raw files. It is an audit-traceable interpretation package that connects measured responses to exploration decisions.
Designing the Survey Around the Decision
The most common failure in mine mapping is collecting technically impressive data without defining the decision it must support. Here, the decision framework is established before sensor selection: refine lithological contacts, map structures beneath partial cover, identify alteration expressions, and rank drill targets along the principal mineralized corridor.
A practical sensor configuration combines drone magnetics, LiDAR, calibrated photogrammetry, and, where mineralogical discrimination is justified, hyperspectral imaging. Each modality contributes a different line of evidence.
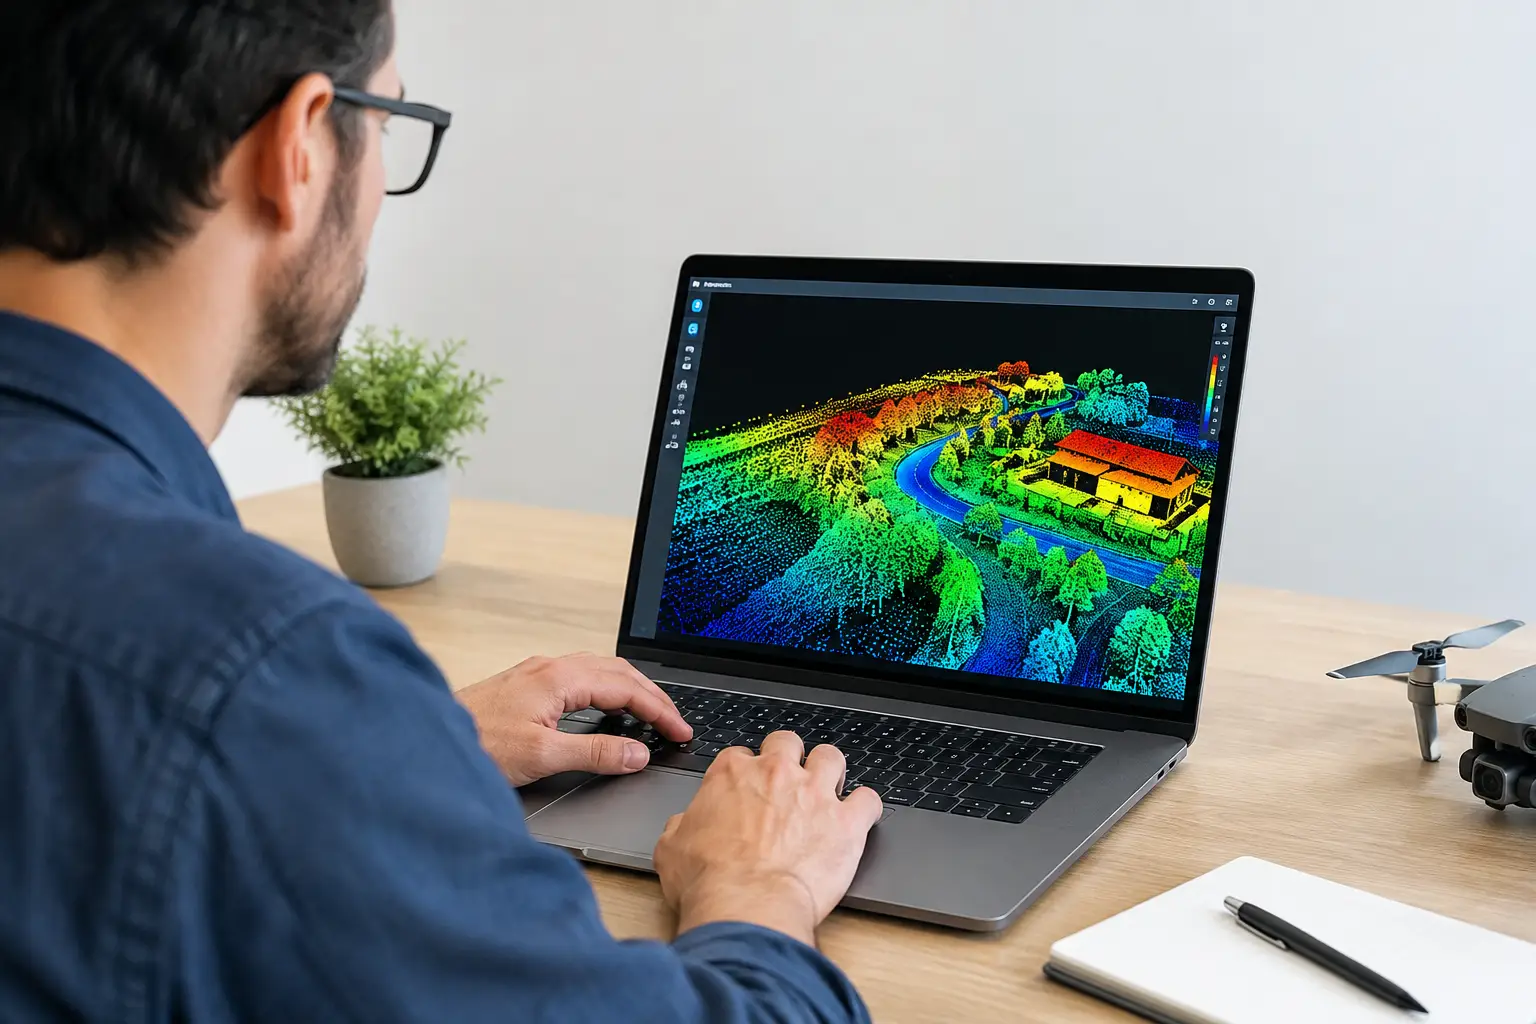
Magnetics is used to resolve variations in magnetic susceptibility associated with lithology, structures, and possible intrusive bodies. LiDAR provides a high-density bare-earth terrain model that can reveal subtle scarps, lineaments, drainage disruption, and abandoned workings. Photogrammetry provides current orthomosaic coverage and a three-dimensional surface model for geological context and field navigation. Hyperspectral data can help distinguish iron oxides, clays, carbonates, and other surface alteration indicators, but only where spectral conditions, ground exposure, and validation samples support that interpretation.
The survey design also accounts for what can distort results. Magnetic data requires compensation for aircraft motion, consistent flight direction, suitable line spacing, adequate terrain clearance, and base-station control for diurnal variation. LiDAR and imagery require ground control or properly validated direct georeferencing. In desert environments, low texture, reflective surfaces, dust, and heat haze can affect image quality. These are operational variables, not post-processing inconveniences.
Acquisition: Low Altitude, Controlled Coverage
In this example, magnetic lines are flown perpendicular to the expected strike of the main structures, with tie lines crossing them at a wider interval. The line spacing is selected based on the smallest geological feature the program needs to resolve, available terrain clearance, and the expected depth of interest. Tighter spacing improves near-surface resolution but increases flight time, processing volume, and budget. There is no universal “best” line spacing.
LiDAR and photogrammetry are acquired with overlap sufficient to build a reliable terrain and surface model across the survey block. Flight paths are adjusted around steep escarpments and narrow wadis to maintain consistent sensor geometry. Ground control targets are surveyed at stable, visible locations, while independent checkpoints are reserved for accuracy assessment rather than used to force the model into agreement.
Daily field procedures include pre-flight checks, sensor calibration confirmation, battery and payload logs, weather records, mission files, and data backup verification. For a mining client, this operating discipline matters as much as the aircraft. If results later influence drilling, resource modeling, permitting, or capital allocation, the chain from acquisition to interpretation must be reconstructable.
Processing the Data Into Comparable Evidence
The magnetic workflow begins with synchronization, compensation, diurnal correction, quality review, and removal of residual line-level noise. The processed data is then gridded at a cell size appropriate to line spacing and flight altitude. Derivative products may include reduced-to-pole transformations where justified by latitude and remanence assumptions, vertical derivatives, tilt derivatives, analytic signal, and directional filters.
These products are not interchangeable. A first vertical derivative can sharpen shallow contacts but also amplify noise. Analytic signal may assist in locating magnetic source edges, yet it does not independently identify rock type or ore. Interpretation must remain tied to mapped geology, petrophysical measurements, and field validation.
LiDAR classification separates ground returns from vegetation, structures, and other non-ground objects, producing a digital terrain model. Hillshades generated from multiple illumination angles make subtle features more visible than a single shaded relief image. The orthomosaic is radiometrically balanced and checked against surveyed control. If hyperspectral data is included, it undergoes atmospheric correction, reflectance calibration, and masking of shadows or low-confidence pixels before mineral index mapping.
All datasets are then brought into a common coordinate reference system and tested for positional agreement. This co-registration stage is critical. A fault inferred from magnetics that is displaced from a LiDAR lineament by several meters may be a geological insight, or it may be a georeferencing error. The distinction must be resolved before target ranking.
Interpreting the Desert Mine Mapping Example
The integrated map reveals a northwest-trending magnetic boundary extending across areas previously interpreted as featureless alluvial cover. LiDAR identifies aligned drainage deflections and low-relief scarps along the same corridor. In the exposed southern segment, field mapping confirms silicified breccia and iron-oxide staining near splays off the main structure.
The highest-priority target is not selected because it has the strongest magnetic anomaly. It is selected because several independent indicators converge: a magnetic discontinuity consistent with faulting, a crosscutting structural intersection, a terrain expression visible in the LiDAR model, alteration signatures in exposed ground, and favorable proximity to historical workings. This is a materially stronger basis for action than any isolated anomaly.
A second anomaly is downgraded despite its amplitude. It follows a mapped mafic unit with no supporting structural complexity or alteration evidence. The data still has value - it improves the geological map and reduces the risk of misinterpreting the feature later - but it does not earn a priority drill collar.
The output is a ranked target register. Each target includes coordinates, dimensions, interpreted structural setting, magnetic characteristics, surface evidence, confidence level, recommended verification work, and the data layers supporting the interpretation. Uncertainty is stated directly. Covered zones may warrant reverse-circulation drilling, while exposed targets may first require systematic mapping, channel sampling, or trenching.
QA/QC Makes the Result Defensible
For technical teams and investment committees, confidence depends on more than visual map quality. The reporting package should document sensor specifications, calibration records, flight parameters, navigation solution, ground control methodology, processing sequence, exclusion areas, noise characteristics, positional accuracy, and limitations.
Cross-validation is equally important. Interpreted faults should be checked against field observations where accessible. Spectral alteration classes should be tested with field spectroscopy or laboratory assays. Magnetic units should be compared with susceptibility readings from outcrop, float, and drill core when available. A target model becomes more reliable as independent evidence agrees, not as map layers accumulate.
This approach also protects procurement and governance. An auditable workflow allows the client’s geologists, consultants, and regulators to understand how the interpretation was produced and where its confidence boundaries lie.
What This Changes for the Drill Program
The immediate value is better drill placement. Rather than distributing holes across broad, poorly constrained anomalies, the exploration team can test the structural positions most likely to explain the combined dataset. It can also design collars and access routes using current terrain intelligence, reducing avoidable mobilization delays.
The broader value is sequencing. High-resolution geospatial intelligence can separate targets that require immediate drilling from those that need surface verification, geochemistry, or additional geophysics. That distinction prevents exploration budgets from being consumed by anomalies that look compelling only in isolation.
For desert projects, the strongest mapping program is therefore not the one with the largest sensor inventory. It is the one that produces calibrated, cross-validated evidence tied to a specific geological decision. When the first drill collar is staked, every meter should be traceable back to a clear and testable interpretation.